
Phosphorus in Inconel 706: How 0.017 % P Raises Stress-Rupture Life by 130 %
56.8 hours to 130.7 hours at 650 °C and 690 MPa — from 150 ppm more phosphorus and a heat treatment designed to push it out of solution as grain-boundary precipitates. What the microstructure shows, and why the boundary is the whole story.
Inconel 706 exists because Inconel 718 cannot be scaled up indefinitely. Niobium at 5 % in 718 segregates badly during solidification of a very large ingot, and the black spots and Laves phase that follow condemn the forging. Alloy 706 halves the niobium to about 3 %, raises iron to roughly 37 %, and compensates with more titanium. The result is a leaner, molybdenum-free precipitation-hardening alloy that can be cast as a sound ingot large enough for gas-turbine discs over two metres in diameter — the parts that no other wrought superalloy can deliver. It is strengthened by γ″ and γ′ as 718 is, and it holds its strength to about 650 °C.
In the specification books, phosphorus is a residual. It sits in the chemistry table with an upper limit, between sulfur and silicon, and nobody designs a heat around it. That is why the behaviour of trace phosphorus in wrought nickel–iron superalloys is worth a second look: a series of studies on 718-type and 718Plus-type alloys has shown that small amounts of phosphorus in solid solution segregate to grain boundaries, lower the boundary energy, modify what precipitates there, and measurably extend stress-rupture life.
The interesting question is what happens when the phosphorus content is high enough that it no longer stays in solution. In Alloy 706 the solubility is low, and earlier work established a threshold: after a hold at 980 °C, heats containing more than about 0.008 % P precipitate a phosphorus-rich phase at the grain boundaries. This article looks at two heats of the same base chemistry — 0.002 % P and 0.017 % P — put through an identical heat treatment, and at what the difference does to the boundary structure and to stress-rupture behaviour at 650 °C and 690 MPa. The short version: the high-phosphorus heat lasts 130 % longer and stretches 47 % further before it breaks, and neither number comes from the matrix.
Two Heats, One Heat Treatment
The base heat was vacuum induction melted and analysed by ICP-AES. Its chemistry is given in Table 1: 42.4 % nickel, 15.92 % chromium, 2.82 % niobium, 1.89 % titanium, 0.35 % aluminium, iron balance — the standard 706 balance, with the carbon and boron levels kept low enough that the grain boundary chemistry is controlled by the phases under study rather than by coarse carbides.
Table 1. Chemical composition of the base heat (mass fraction, %; iron balance).
| Ni | Cr | Nb | Ti | Al | C | B | P | Fe |
|---|---|---|---|---|---|---|---|---|
| 42.4 | 15.92 | 2.82 | 1.89 | 0.35 | 0.04 | 0.0045 | 0.002 | bal. |
Portions of the base heat were remelted in a vacuum induction furnace with an FeP addition and cast into 8 kg ingots, giving two sub-heats at 0.002 % P and 0.017 % P. Both were homogenized, cogged and hot rolled to 16 mm bar, then given the same four-step heat treatment. The schedule is in Table 2, and each step has a specific job in this story.
Table 2. Heat treatment applied to both phosphorus levels.
| Step | Condition | Purpose |
|---|---|---|
| Solution | 1060 °C / 2 h, air cool | Dissolve γ″/γ′ and boundary phases; homogenize phosphorus in the matrix |
| Phosphide hold | 980 °C / 3 h, air cool | Let P diffuse to boundaries with Nb and Ti; precipitate the phosphide |
| η hold | 845 °C / 3 h, air cool | Peak temperature for grain-boundary η-Ni3Ti precipitation |
| Double age | 730 °C / 8 h, cool 55 °C/h to 620 °C / 8 h, air cool | Precipitate γ″ and γ′ in the matrix |
The 980 °C hold is the step that makes the experiment: it is hot enough for phosphorus, niobium and titanium to keep moving, and cool enough that the phosphide is stable. Without it, a high-phosphorus heat would simply carry more P in solution, and the comparison would be about solute segregation rather than about a precipitate. Structure was examined by optical and scanning electron microscopy after electrolytic etching in 10 % H2SO4, element distributions were mapped by electron probe microanalysis, and stress-rupture testing ran at 650 °C and 690 MPa on smooth specimens of 5 mm gauge diameter and 25 mm gauge length, two specimens per heat.
Grain Size Explains None of It
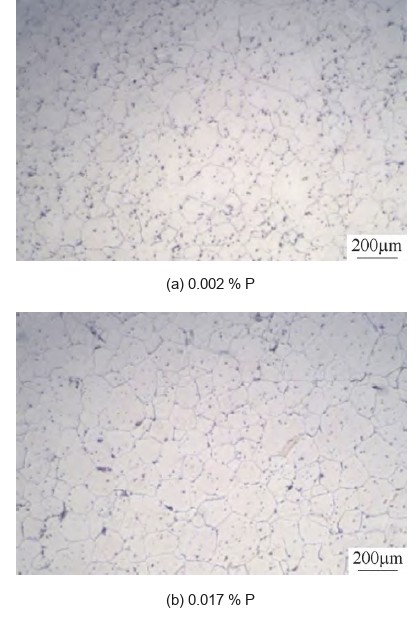
The first thing to rule out is the grain size, because phosphorus is a known grain-boundary segregant and segregation usually drags boundary mobility with it. It does not here. The two heats come out of the same schedule at 108 µm and 119 µm mean grain size — a difference of about 10 % that sits inside the scatter of a lineal-intercept measurement on a handful of fields (Figure 1). For the purpose of the comparison the two structures start from the same grain size, which pushes the explanation down to the boundary itself.
Where the Phosphorus Sits: A Boundary Phosphide
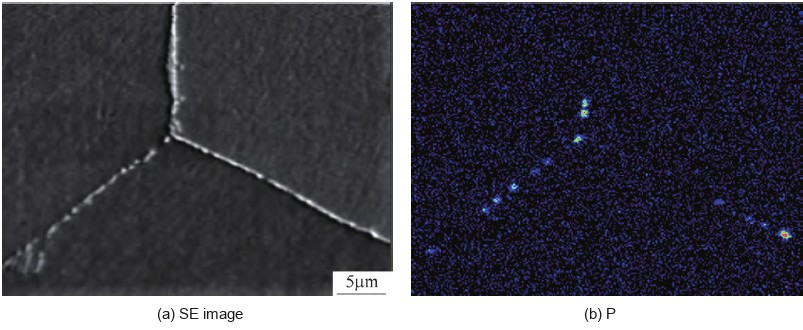
Electron probe mapping of the 0.017 % P heat shows the boundaries decorated with precipitates, and a fraction of those particles are phosphorus-rich (Figure 2). Compared with the matrix, the P-rich particles are also enriched in niobium and titanium and depleted in nickel, iron and chromium — the signature of the orthorhombic MNP phosphide reported previously in this alloy, where M is Nb and Ti and N is Ni, Fe and Cr. That phase appears after the 980 °C hold once phosphorus exceeds roughly 0.008 %, which is exactly why the 0.002 % heat shows none of it.
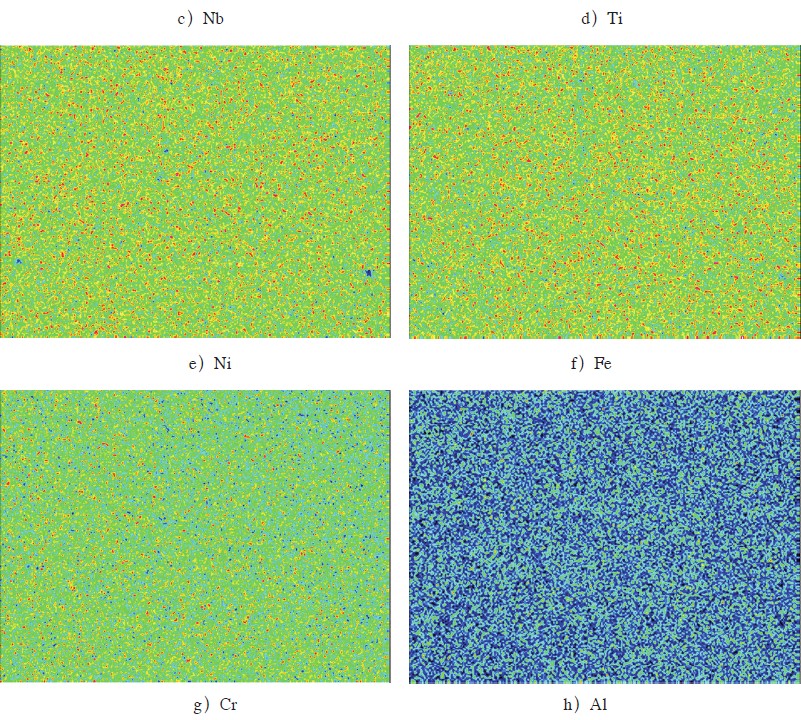
The full set of element maps in Figure 3 completes the picture. Niobium and titanium are concentrated in the same places as phosphorus; nickel, iron and chromium are depleted there; aluminium follows the Nb–Ti pattern weakly. That is not the chemistry of a random segregation zone — it is a compound, and it is the reason the boundary structure downstream changes.
η-Ni3Ti: The Phase That Actually Changes
The boundaries of the low-phosphorus heat are mostly clean. In the 0.002 % P material, most boundaries carry no precipitate at all, a few show a thin lath, and a few show a long needle (Figure 4a–c). In the 0.017 % P heat the situation inverts: most boundaries carry precipitates, appearing as blocky and granular particles and as long needles, and the precipitates are visibly larger (Figure 4d–f). Image analysis puts the boundary precipitate fraction at 0.61 % by area in the high-phosphorus heat; the low-phosphorus heat has too little to measure.
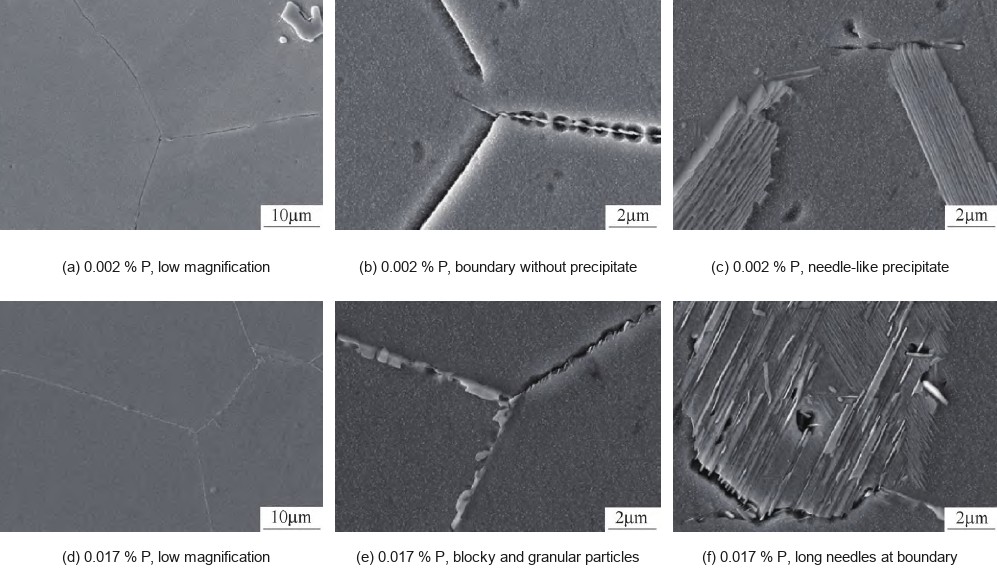
That phase is η-Ni3Ti, hexagonal close packed, enriched in nickel, titanium, niobium and aluminium and poor in iron and chromium — consistent with the 845 °C hold, which is the precipitation peak for η at these boundaries. The question is why phosphorus, which is not a constituent of η, multiplies it by so much.
The answer is a sequence, not a single reaction. After the 1060 °C solution treatment the phosphorus is distributed evenly through the matrix. During the 980 °C hold it migrates to the boundaries together with niobium and titanium — the three elements co-segregate, a behaviour documented by Auger analysis in 718, where niobium boundary coverage rises with phosphorus coverage. Where the local phosphorus concentration is high enough, the phosphide forms. Where it is not, the niobium and titanium remain segregated at the boundary without a partner. That leftover segregation is what the 845 °C hold then uses: at the η precipitation peak, boundary niobium and titanium combine with nickel from the adjacent matrix to form η-Ni3Ti. High phosphorus therefore leaves a larger reservoir of boundary Nb and Ti, and produces a larger η population.
The η coverage is not uniform, and it should not be. Grain-boundary precipitation in nickel-base alloys depends on boundary character: high-angle boundaries precipitate readily, low-angle and low-Σ coincidence-site boundaries much less. The same behaviour is familiar from δ phase in 718 and η in 718Plus. On the micrographs this reads as some boundaries fully decorated and others still bare a few micrometres away — and it matters, because the bare ones are where the cracks start, as the longitudinal sections later show.
Stress Rupture at 650 °C and 690 MPa: 56.8 h Versus 130.7 h
Against that structural difference, the mechanical result is unambiguous. The 0.002 % P heat ruptures after 56.8 h at 650 °C and 690 MPa; the 0.017 % P heat lasts 130.7 h. That is a 130.1 % increase in rupture life. Rupture elongation moves the same way, from 4.9 % to 7.2 %, a 46.9 % increase. Both numbers are means of two specimens, and both move in the favourable direction at once — which is the important part.
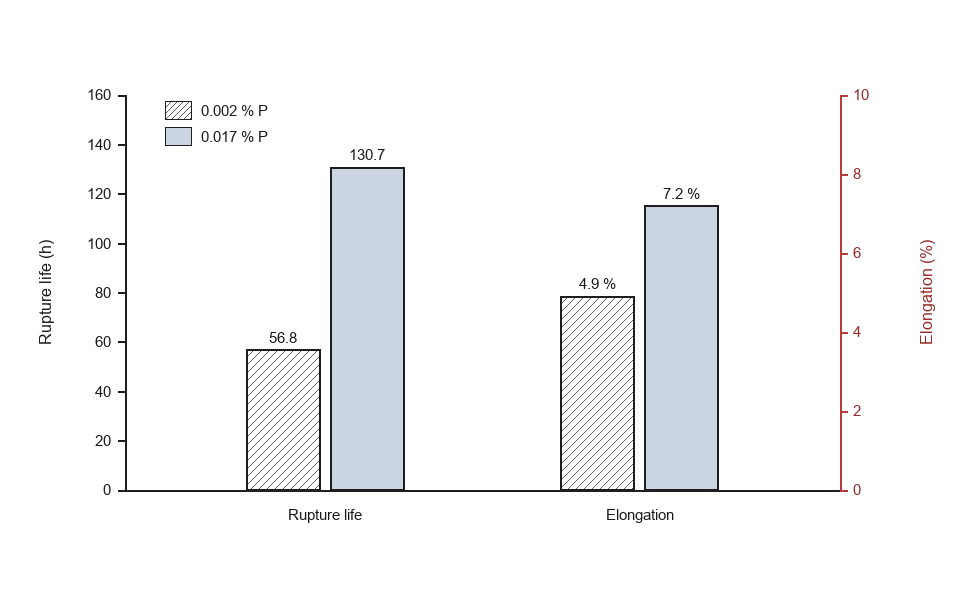
A strength increase bought with a ductility loss would point at the matrix — more γ″, more solid-solution hardening, something that makes the material stronger and less forgiving. Here life and elongation both improve, and the grain size is unchanged. The only structural variable left is the boundary. That is the signature of a boundary-strengthening mechanism, and the fractography confirms it.
The Fracture Path Points at the Boundary
Both heats fail in two stages: a slow intergranular stage, then an overload stage when the remaining section can no longer carry the load. What changes between the heats is the character of each stage.
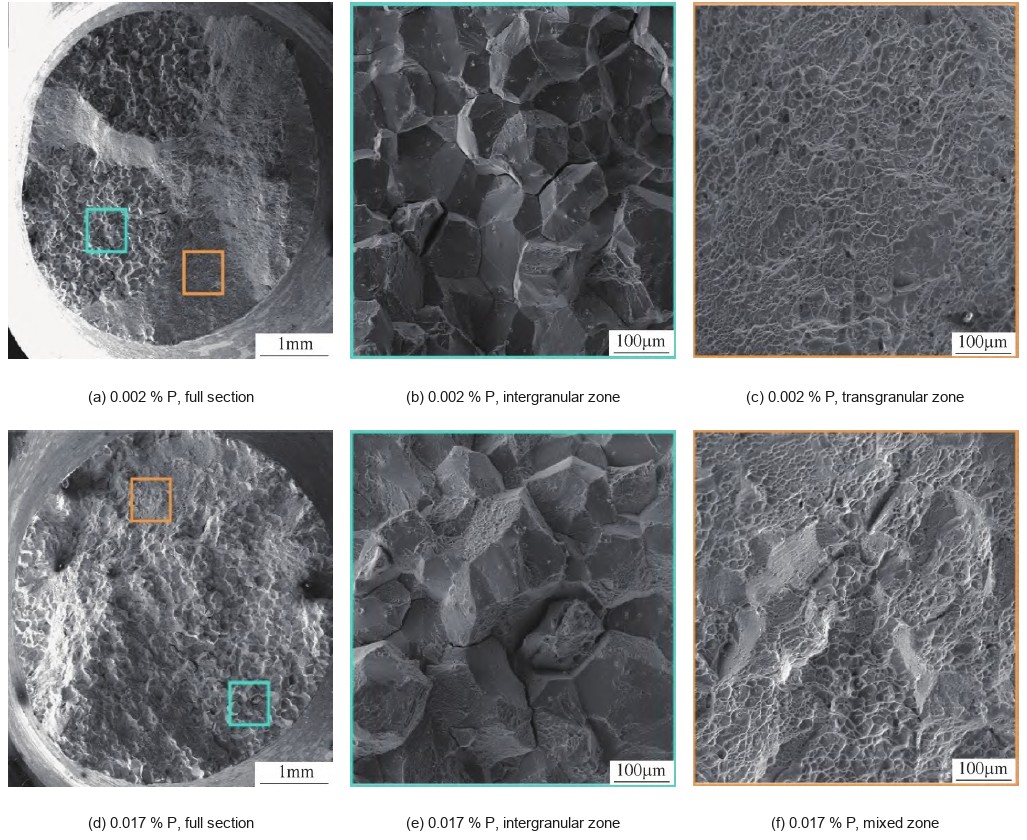
In the 0.002 % P heat, the fracture surface carries a distinct intergranular zone and a distinct transgranular zone (Figure 6a–c). The intergranular facets are smooth and clean — the grains have separated without visible local deformation, which is exactly what a 4.9 % rupture elongation looks like from the inside. The transgranular overload zone is fully dimpled. In the 0.017 % P heat, the intergranular zone still exists, but the final fracture is a mixture of intergranular and transgranular (Figure 6d–f), and — the detail worth pausing on — the intergranular facets now carry dimples. That means the boundary region deformed plastically before it parted. Secondary cracks appear between grains in both heats.
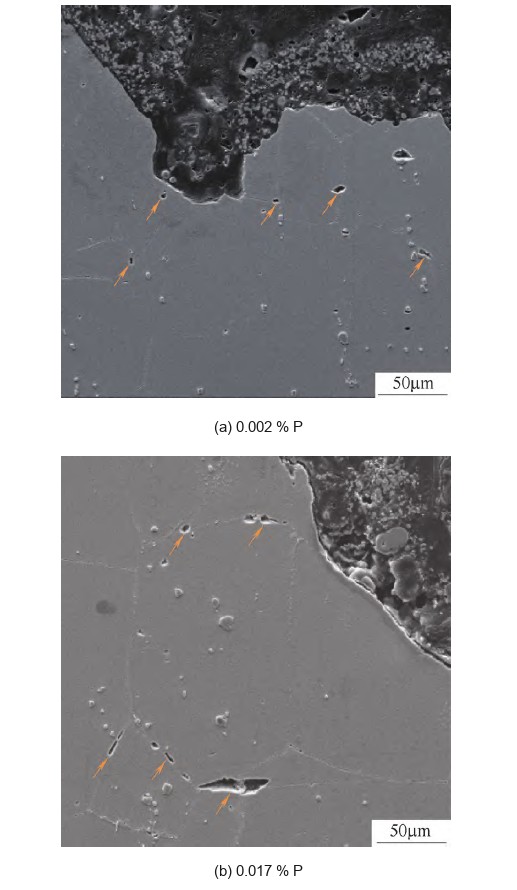
The longitudinal sections in Figure 7 show where the damage lives. Both heats contain intergranular cracks and voids beneath the fracture, and in both the cracks sit preferentially on boundaries that carry no η precipitate. The sequence is consistent across the two heats and across the two techniques: cracks initiate at the boundary, link along it, form the intergranular zone, and the specimen finally overloads when the remaining section is too small. The difference is how much boundary damage the material can absorb before that point — and a boundary decorated with η absorbs far more.
Why 0.61 % of Precipitate Changes a Life by 130 %
At 650 °C a grain boundary in a nickel–iron superalloy is not a passive interface. It slides, it accommodates strain by diffusion, and where sliding is blocked it concentrates stress into a triple point or a boundary ledge. Once the local stress exceeds the cohesive strength, a cavity opens; cavities link; the boundary separates. The whole intergranular stage of a stress-rupture test is that process running to completion.
A boundary precipitate interrupts it in three ways. It pins the boundary against sliding, so the sliding rate drops. It turns a planar boundary into a staggered one, so a crack that follows the boundary has to change direction and absorb energy. And it loads the surrounding matrix, forcing the material near the boundary to deform plastically instead of separating cleanly — which is exactly the dimpled intergranular facets seen in Figure 6e.
What makes the 0.61 % figure interesting is its location rather than its size. As a volume fraction of the whole alloy it is trivial; as a coverage of the boundaries that carry the damage it is decisive. This is the same principle that makes boron useful at 50 ppm and why boundary engineering, rather than bulk alloying, is the lever on stress-rupture life in these alloys.
What This Means When You Specify Alloy 706
Phosphorus is a controlled addition in this context, not a tramp element. Buying to a chemistry range alone will not reproduce these numbers, because the benefit depends on phosphorus being pushed out of solution as a boundary phosphide. In a purchase specification that means two things at once: a phosphorus range at the top of the permitted window, and a heat treatment that includes the 980 °C hold. Take either away and the comparison collapses back to a solute effect.
Qualify on stress rupture, not on tensile. Room-temperature tensile properties will not distinguish these two heats — the grains are the same size, the matrix is the same, and the precipitation hardening is the same. The difference appears only when the boundary is made to carry the damage, at temperature and under load. A 650 °C / 690 MPa rupture test with a minimum life and a minimum elongation is the only acceptance test that sees it.
Look at the boundary before you look at the certificate. The relevant microstructural check is not grain size but boundary coverage — how much of the boundary network carries η, and whether the phosphide is present at all. A metallographic section from a test coupon, taken after the full heat treatment, answers that question in an hour.
Do not extrapolate the phosphorus upwards. The phosphide that delivers the benefit is also a brittle phase, and this work covers 0.002 % to 0.017 %. Above that window the balance can invert: coarse phosphide films, a boundary network that is fully embrittled rather than decorated, and a loss of the ductility that the η particles were buying. Phosphorus also interacts with strain-age cracking and weldability in this family, which is why the addition has to be qualified on the actual part, not just on the test bar.
For the large-disc application that 706 was designed for, the practical message is that the alloy’s advantage over 718 — a sound, segregated-free ingot at two metres diameter — is delivered by the forging route, but the last 130 % of rupture life is delivered by the boundary. Both have to be specified. If you are sourcing nickel-base disc and shaft forgings, our nickel-based alloy range and forging programme cover this family, and the heat-treatment work behind these results is described under heat-treatment services. For the sister alloy, the same boundary logic applies in Inconel 718 turbine disc forging.
Conclusion
1) Two heats of Alloy 706 at 0.002 % and 0.017 % P, given an identical four-step heat treatment, arrive at the same grain size (108 µm and 119 µm) but at completely different boundaries: the low-phosphorus heat has mostly clean boundaries with occasional laths and needles, the high-phosphorus heat has most boundaries decorated with blocky, granular and needle-shaped precipitates at a 0.61 % area fraction.
2) The phosphorus leaves solution as an orthorhombic MNP phosphide at the boundaries during the 980 °C hold once it exceeds about 0.008 %. The particles are enriched in P, Nb and Ti and depleted in Ni, Fe and Cr. Phosphorus promotes η-Ni3Ti indirectly, through P–Nb–Ti co-segregation: the Nb and Ti left at the boundary after the phosphide forms are what the 845 °C hold converts to η.
3) At 650 °C and 690 MPa, 0.017 % P raises rupture life from 56.8 h to 130.7 h (+130.1 %) and rupture elongation from 4.9 % to 7.2 % (+46.9 %). Life and ductility rise together, which rules out a matrix-strengthening explanation.
4) The boundary is the crack path in both heats, but in the high-phosphorus heat the intergranular facets carry dimples and the final fracture is mixed — the boundary accommodates plastic strain before separating. η-decorated boundaries relieve stress concentration and delay crack initiation and link-up, and that is the whole of the improvement.