
Quenching and Tempering 3Cr-1Mo-0.2V Roll Sleeve Steel: What a 10 °C Shift Costs
Move the quench furnace by 10 °C and you gain 0.4 HRC — then lose it again to a coarser martensite lath. Move the temper back by 50 °C and you trade 220 MPa of tensile strength for 44 J of impact energy. The test data behind the 910 °C / 600 °C window for 3 % Cr-1 % Mo-0.2 % V caster sleeves.
A roll sleeve on an aluminium twin-roll caster is asked to do two contradictory jobs at once. It is the mould: molten aluminium at 660–700 °C freezes against its surface, and the shell must pull heat out of the metal fast enough to set a strip in two or three seconds. It is also the roll: the same shell carries the rolling load, the friction of the bite and the thermal cycling of every revolution. The surface swings between roughly 30 °C and 650 °C at a frequency set by the casting speed — a thermal fatigue test that runs continuously for weeks.
That combination is why the sleeves are not made from a plain hot-work die steel. The grade used here is a 3 % chromium, 1 % molybdenum, 0.2 % vanadium steel with about 0.35 % carbon, written 3Cr-1Mo-0.2V generically and bought under the AMS 6481 and 32CDV13 designations depending on the market. Chromium carries the hardenability and the oxidation resistance, molybdenum holds the high-temperature strength and the resistance to softening during tempering, and vanadium pins the prior austenite grain size and adds a secondary hardening response. The chemistry is not the difficult part. The heat treatment is.
Most of the published work on these shells attacks the problem from the surface: laser alloying with Cr or Co, nitriding, cladding, induction hardening. That work is real, and it extends life. But every surface treatment sits on top of a bulk heat-treatment condition, and the bulk condition decides what the surface layer is bonded to. A shell quenched 10 °C too hot has a coarser substructure underneath the same laser track; a shell tempered 50 °C too high never reaches the hardness the surface layer is designed to support. This article works from the inside out — it quantifies what the quench temperature and the tempering temperature each do to the microstructure, the hardness and the toughness of the grade, and where the two windows actually close.
The Test Heat and What Its Chemistry Already Decides
The work was carried out on a production heat of the roll-sleeve grade, analysed by optical emission spectrometry. The analysis is given in Table 1. Two things in it matter more than the alloy content itself: phosphorus at 0.0005 % and sulfur at 0.0002 % are at the limit of what an electric-arc furnace heat can reach without a refining step, which points to a ladle-refined or remelted route; and the residual elements — nickel 0.375 %, copper 0.022 %, aluminium 0.009 % — are low enough that they will not shift the critical temperatures or embrittle the grain boundaries during a long temper.
Table 1. Chemical composition of the 3Cr-1Mo-0.2V test heat (mass fraction, %).
| C | Si | Mn | P | S | Cr | Mo | Ni | Al | Cu | V |
|---|---|---|---|---|---|---|---|---|---|---|
| 0.351 | 0.282 | 0.298 | <0.0005 | <0.0002 | 3.11 | 1.04 | 0.375 | 0.0090 | 0.0223 | 0.222 |
For the same reason the grade is used for hot nuts, bolts and studs as well as sleeves, the alloy design is a compromise: enough chromium for through-hardening a 200 mm wall, enough molybdenum to survive 600 °C for years, enough vanadium to keep the grain size in check through repeated austenitizing. Every heat-treatment decision below is a decision about how much of that alloy content is allowed to do its job.
Critical Temperatures and the Test Programme
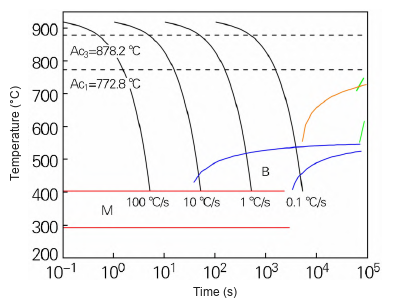
The continuous cooling transformation diagram was calculated for this chemistry before any furnace time was booked. It puts the lower critical temperature Ac1 at 772.8 °C and the upper critical temperature Ac3 at 878.2 °C, which fixes the fully austenitizing range above roughly 880 °C. The CCT curve in Figure 1 also shows how wide the ferrite–pearlite and bainite fields open up as the cooling rate falls: at 100 °C/s the transformation is suppressed to martensite, at 1 °C/s bainite appears above 400 °C, and at 0.1 °C/s the curve has moved far enough right that a soft structure is unavoidable. For a sleeve with a wall thickness measured in tens of millimetres, that is the argument for oil rather than air — the same reasoning that governs quenching medium selection in every hardenable grade.
The quench matrix covered 883 °C to 1020 °C — from just above Ac3 to well into the coarsening range — with a 50 min soak and an oil quench, chosen to deliver a fully martensitic structure at the hardness the sleeve needs. Tempering was then run at 550 °C, 600 °C and 650 °C for 2 h, followed by oil cooling. Structure was examined by optical and scanning electron microscopy after polishing and etching in 4 % nital; hardness was taken on the Rockwell C scale; phase constitution was checked by X-ray diffraction with a Cu target over 40–110° 2θ at a 0.01° step, 45 kV and 200 mA; dislocation density was derived from the diffraction line breadths by the Williamson–Hall method; tensile properties came from a 100 kN universal frame and impact energy from a 300 J pendulum machine on 10 × 10 × 55 mm U-notched specimens.
Quenching Temperature: 920 °C Wins the Hardness Test, 910 °C Wins the Job
As-quenched hardness climbs steeply out of the Ac3 range, peaks and then falls away. The values in Figure 2 run 44 HRC at 883 °C, 49.8 HRC at 910 °C, a maximum of 50.2 HRC at 920 °C, and then a decline that accelerates above 960 °C until the 1020 °C specimen sits at 34 HRC. Two different mechanisms produce the two sides of that curve, and they are worth separating because they point to opposite decisions.
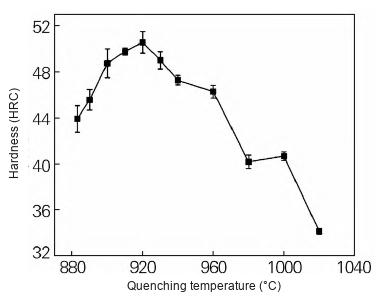
On the rising side, the limiting factor is dissolution. At 883 °C, only a few degrees above Ac3, a substantial population of undissolved carbides remains in the structure, and every carbide that stays out of solution takes carbon and chromium out of the austenite that later becomes martensite. Raising the temperature to 910 °C dissolves most of them: the optical micrographs in Figure 3 show a fine, uniform lath martensite at that temperature, and the refinement itself contributes to hardness. At 920 °C the carbides are further into solution, the austenite carries more carbon and alloy in solid solution, and the martensite that forms is more supersaturated. Solid-solution strengthening rises — enough to outweigh the beginning of lath coarsening, which is why the hardness still moves up slightly.
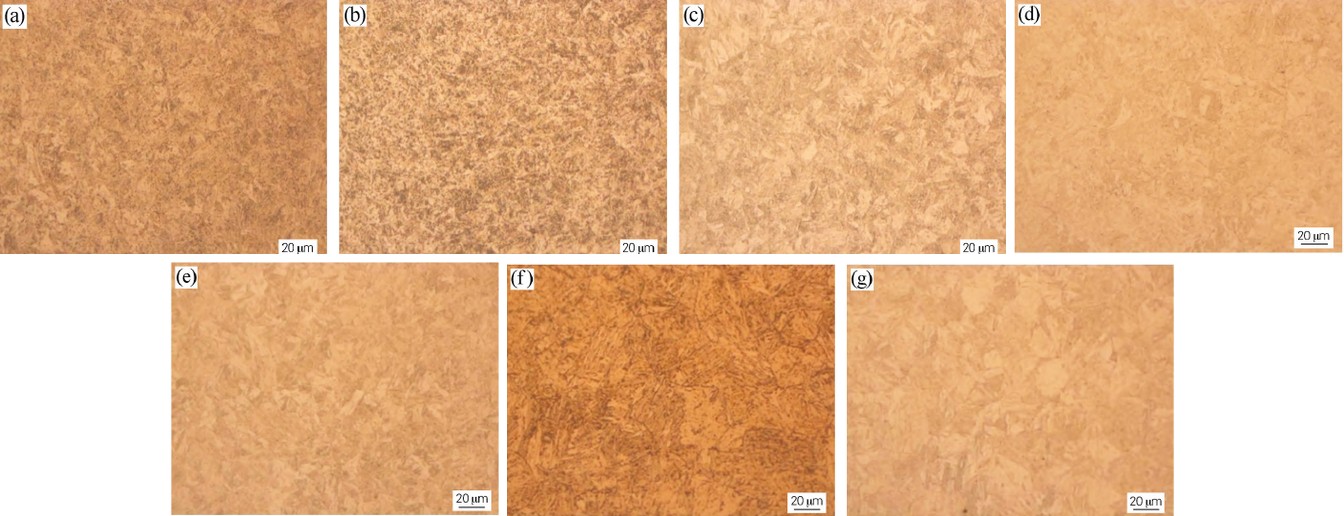
Beyond 920 °C the balance tips. The carbide population is largely gone, so there is no further solid-solution gain to be had, but the austenite grain keeps growing — and a prior austenite grain boundary is not erased by the martensite transformation; it simply becomes the boundary between martensite packets. Coarse packets are the standard route to a low toughness in a medium-carbon steel, and the hardness curve gives no warning, because hardness is not sensitive to packet size the way toughness is.
The engineering decision therefore does not follow the maximum. The 0.4 HRC difference between 910 °C and 920 °C is smaller than the repeatability of a Rockwell C test on a production surface, while the difference in lath and packet size between the two is visible in the microscope. The programme selected 910 °C — the temperature that delivers essentially the same hardness from a finer structure — for all subsequent tempering work. In practice, for a sleeve that will see thermal cycling for months, that is the only defensible choice of the two.
Tempering: A Straight Line Down, and Where It Has to Stop
Tempering behaves very differently from quenching. There is no peak and no subtle trade-off: hardness falls almost linearly with temperature across the range tested, from about 40.6 HRC at 550 °C to 35.6 HRC at 600 °C and 28.3 HRC at 650 °C — a slope of roughly −0.12 HRC per °C, as Figure 4 shows. That linearity is what makes tempering temperature such a powerful and such a dangerous control knob. It is also what makes furnace uniformity a quality issue rather than a housekeeping issue: a ±10 °C spread across a 1,200 mm-long sleeve is a ±1.2 HRC spread, which for this grade is the difference between passing and failing a 35 HRC floor.
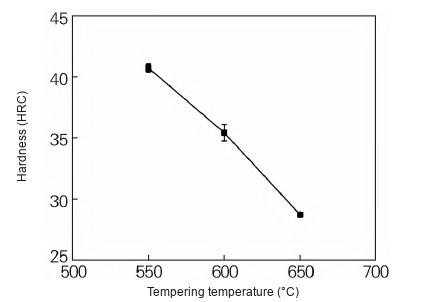
The 35 HRC floor is not arbitrary. These sleeves run against aluminium, a soft metal: if the shell is too soft, the surface picks up metal, wears into a non-uniform profile and prints that profile into the strip; if it is too hard, it loses the ability to relax thermal stress by local plastic flow and cracks earlier. The industry band for aluminium caster shells sits above roughly 35 HRC after tempering, which puts the whole 550–650 °C range under a hard constraint. At 650 °C the sleeve is at 28.3 HRC — nearly 7 HRC below the floor, and out of service regardless of how good its toughness looks.
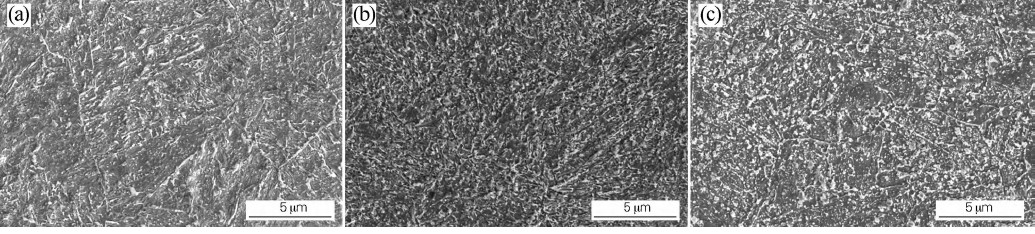
The microstructural reason is visible in Figure 5. All three conditions produce a tempered sorbite, as expected. At 550 °C the structure is still recognisably martensitic in orientation, with a ferrite matrix, a light scatter of fine carbides concentrated near the former lath and grain boundaries, and a small amount of retained austenite. Raising the temperature to 600 °C precipitates more carbide, distributes it more evenly through the ferrite and drops the retained austenite sharply — the structure is more completely tempered. At 650 °C the carbides have coarsened and begun to link up along the grain boundaries in a continuous or semi-continuous film. That is the classic precursor to a lower strength and a poorer stress-rupture behaviour, and it matches the hardness and tensile data exactly.
What the X-ray Data Adds: Dislocation Density Falls by Two Orders of Magnitude
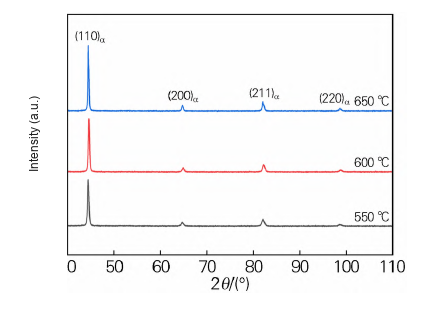
If tempering only changed carbide size, the strength drop from 550 °C to 650 °C would be modest. It is not modest — tensile strength falls by more than a third — and the X-ray work explains why. Figure 6 shows the diffraction patterns of the three tempered conditions. Only four peaks appear, indexed as (110)α, (200)α, (211)α and (220)α; there is no austenite reflection anywhere in the 40–110° range. Retained austenite is therefore below the detection limit of the method, which for a laboratory diffractometer means a few percent at most. The 550 °C structure retains its martensitic orientation without retaining measurable austenite.
The peak breadths carry the more useful information. Using the Williamson–Hall separation, the instrumental broadening is removed first, then the residual breadth is split between crystallite size and microstrain:
Here Δk is the full width at half maximum of the sample peak after correction, θ the Bragg angle, λ the X-ray wavelength, D the average crystallite size, ε the microstrain, b the Burgers vector and ρ the dislocation density. The instrument correction was taken from the 650 °C specimen, the condition with the narrowest peaks. Fitting three reflections per condition gives dislocation densities of 1.60 × 1012 cm−2 after tempering at 550 °C, 4.33 × 1010 cm−2 at 600 °C and 6.70 × 109 cm−2 at 650 °C.
That is a factor of 37 between 550 °C and 600 °C, and a factor of 240 across the full 100 °C span. Recovery is doing most of the work: at 550 °C the dislocation substructure inherited from the martensite transformation is still locked in place by the fine carbide dispersion, and the steel is strong largely because dislocations cannot move. By 600 °C the dislocations have been able to annihilate and rearrange into lower-energy configurations, and by 650 °C the density has fallen to a level where the obstacle strength of the dislocation network itself is no longer a significant contributor. The hardness and strength curves in Figures 4 and 7 are not two separate phenomena — they are the same recovery process seen through two different instruments.
Strength, Ductility and Impact Energy: Reading the Trade-Off Properly
The tensile and impact results are collected in Figure 7 and Table 2. Tensile strength falls from 1498.63 MPa at 550 °C to 1278.34 MPa at 600 °C and 971.55 MPa at 650 °C; yield strength follows from 1345.50 MPa to 1141.77 MPa to 847.48 MPa. Total elongation after fracture barely moves — 14.22 %, 16.46 % and 15.17 %, a band of just over two percentage points — while impact absorbed energy more than doubles, from 70.55 J to 114.15 J to 162.85 J.
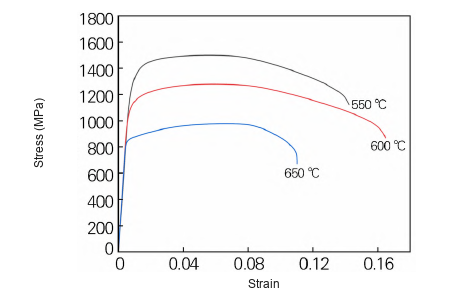
Table 2. Mechanical properties after tempering at three temperatures (910 °C oil quench, 2 h temper).
| Tempering temperature (°C) | Tensile strength (MPa) | Yield strength (MPa) | Total elongation (%) | Impact energy (J) | Hardness (HRC) |
|---|---|---|---|---|---|
| 550 | 1498.63 | 1345.50 | 14.22 | 70.55 | 40.6 |
| 600 | 1278.34 | 1141.77 | 16.46 | 114.15 | 35.6 |
| 650 | 971.55 | 847.48 | 15.17 | 162.85 | 28.3 |
Read as a trade, each 50 °C step of tempering buys about 44 J of impact energy and costs roughly 220 MPa of tensile strength and 4.5 HRC of hardness. The flat elongation is the interesting part: the steel is not becoming more ductile in the tensile test, it is becoming tougher in the impact test. Those are different properties. Elongation measures how far the gauge length stretches before necking; impact energy measures how much energy the structure absorbs while a crack initiates and propagates from a sharp notch. The 550 °C condition is not brittle in tension at all — 14.22 % elongation on 1498 MPa tensile strength is respectable — but it absorbs only 70 J in a notched impact test, which is the number that matters when a sleeve is being thermally shocked at the bite.
The selected condition is 910 °C quench plus 600 °C temper: 1278.34 MPa tensile, 1141.77 MPa yield, 16.46 % total elongation, 114.15 J impact energy and 35.6 HRC. It is the point where the hardness floor is still met, the impact energy has recovered by 60 % over the 550 °C condition, and the strength remains comfortably above the 1100 MPa yield level that the grade is normally specified to in the forged condition. The 650 °C condition looks attractive on toughness alone and is unusable in this application, because 28.3 HRC sits below the wear floor. That is the whole argument for treating 600 °C as a ceiling rather than a starting point for optimisation.
Fracture Mechanism: From Quasi-Cleavage to Uniform Dimples
The impact data has a microstructural signature, and it is visible in the fracture surfaces of Figure 8. After tempering at 550 °C, the surface shows regions of quasi-cleavage — flat facets with river markings — interrupted by a limited number of shallow dimples. That is a mixed ductile–brittle mechanism, and it is consistent with a structure that still carries a high dislocation density and a martensitic orientation.
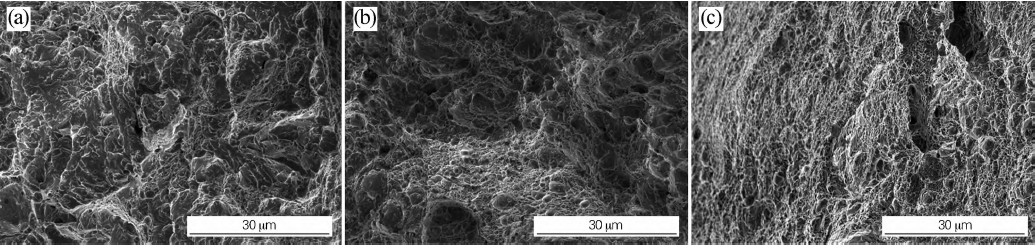
At 600 °C the quasi-cleavage facets are gone and the surface is dimpled throughout, although the dimples vary in size and depth. At 650 °C the dimple field is fine and uniform. The transition from mixed-mode to fully ductile fracture between 550 °C and 600 °C tracks the impact energy step from 70.55 J to 114.15 J almost exactly; the further refinement between 600 °C and 650 °C corresponds to the rise to 162.85 J. For a sleeve, the practical reading is that a 550 °C temper leaves a structure with a finite population of cleavage-favourable paths, and thermal fatigue cracks will find them.
What This Means for Sleeve Procurement and Heat Treatment
Four things follow from the data, and they are the four that tend to be missed in a purchase specification.
The quench temperature should be specified as a window, not a target. 910 °C ± 10 °C is defensible; 910 °C as a setpoint on a furnace with a ±20 °C spread is not. The hardness difference across the 900–920 °C band is inside measurement noise, but the structural difference is not, and an overshoot to 950 °C costs toughness that no tempering cycle will restore.
Tempering temperature is the real hardness control, so treat furnace uniformity as a hardness specification. At −0.12 HRC per °C, a 600 °C temper on a furnace with a 30 °C spread will produce a sleeve with a 3.6 HRC spread from end to end. For a part whose acceptance floor is 35 HRC, that is not a margin — it is a coin toss. Load thermocouples on the sleeve, not just in the chamber, and record the uniformity survey for the tempering furnace, not only for the quench furnace.
Do not use tempering temperature to chase toughness. The 650 °C condition has the best impact energy in the whole matrix and is scrap for this application, because it misses the wear floor by 7 HRC. If more toughness is needed at 35 HRC, the answer is cleaner steel and a finer prior austenite grain size, not a hotter temper.
Verify hardness where it matters. The 35 HRC floor applies to the working surface that contacts the strip, and hardness should be checked there after the final temper, at several axial positions, with the test locations recorded. A single reading on one end of a 2 m sleeve says very little about the rest of it.
For buyers specifying the grade, the equivalent designations matter as much as the numbers: the same 3 % Cr-1 % Mo-0.2 % V chemistry is bought as AMS 6481, as 32CDV13, and as 3Cr-1Mo-0.2V, and the melting route behind it — refined or remelted, with phosphorus and sulfur at the levels in Table 1 — is what makes a 600 °C temper predictable in the first place. A heat with 0.020 % phosphorus and 0.015 % sulfur will not behave the way these curves say it will, which is why the clean-steel side of Cr-Mo-V ingot homogenisation matters as much as the heat-treatment numbers.
Conclusion
1) Quenching the grade from 910 °C produces fine, uniform lath martensite at 49.8 HRC; the 50.2 HRC maximum at 920 °C is not worth the lath coarsening that comes with it, and hardness collapses above 960 °C as the prior austenite grain grows.
2) Tempering between 550 °C and 650 °C gives a tempered sorbite throughout, with carbide precipitation increasing and then coarsening into grain-boundary films, hardness falling linearly at about −0.12 HRC per °C, and dislocation density dropping from 1.60 × 10¹² to 6.70 × 109 cm−2.
3) Strength falls and impact energy rises monotonically with tempering temperature while total elongation stays in a 14.22–16.46 % band; the fracture mechanism shifts from mixed quasi-cleavage plus dimples to fully ductile dimpled rupture between 550 °C and 600 °C.
4) The 910 °C quench plus 600 °C temper condition — 1278.34 MPa tensile, 1141.77 MPa yield, 16.46 % elongation, 114.15 J impact energy, 35.6 HRC — is the only point in the matrix that satisfies both the strength requirement and the 35 HRC wear floor for aluminium cast-rolling sleeves. Treat 600 °C as a ceiling and control the furnace to it.
If you are specifying sleeves or forged roll bodies in this grade, we forge and heat treat to the window above and can supply the corresponding test record; see our forging programme and the heat-treatment services behind it.
Related reading
- Welding and Heat Treatment of 9Cr1Mo and 12Cr1MoV Steel – Expert — same heat treatment thread
- Effect of Aging Process on Low-Temperature Mechanical Properties of 15 — same heat treatment thread