
IN718 VAR Ingot Structure: How Melting Rate Sets Melt Pool, Dendrites and Laves Phase
Three Φ508 mm ingots, one heat of electrodes, and 0.7 kg/min either side of the base melting rate. The melt pool went from 100 to 186 mm deep, the secondary dendrite spacing from 100 to 130 µm, and the Laves phase concentrated towards the centre of every ingot.
Vacuum arc remelting is the last operation that touches an IN718 ingot before it becomes a billet, a forging or a rolled ring. A low-voltage DC arc under vacuum melts the consumable electrode, and the droplets cross an arc gap close to 5000 K before they land in a water-cooled copper mould. Almost everything the ingot will later be judged on is decided in that gap and in the liquid pool beneath it: how fast metal arrives, how deep the pool sits, how steep the gradient is at the solidification front, and how long the last liquid has to segregate before it freezes.
In IN718 that last point is the one that hurts. Niobium is specified at 4.75–5.50 % and partitions strongly into the interdendritic liquid, where it ends up in the Laves phase (Fe,Ni,Cr)2Nb instead of in solution where the γ″ precipitate needs it. Melting rate is the parameter a melt shop actually turns to control this, and the same knob also governs the defects buyers reject ingots for — black spots, white spots and niobium-rich stringers that survive into the billet.
The Trial: One Heat of Electrodes, Three Melting Rates
The electrodes were melted in a 12 t vacuum induction furnace and cast to the composition in Table 1, then remelted in an 8 t VAR furnace to a nominal ingot diameter of Φ508 mm. Three rates were run: a low rate at 0.7 kg/min below the plant’s standard rate, the standard rate itself, and a high rate at 0.7 kg/min above it. The absolute base rate is a plant figure and is not quoted in the source study; what matters for the comparison is that the three heats differ by a controlled pair of steps in the same furnace, on the same electrode heat, with the same helium cooling in the mould–ingot annulus.
Table 1: Chemical composition of the IN718 electrode used for the three VAR heats (mass fraction, %).
| C | Mn | S | P | Cr | Al | Ti | Mo | Ni | Nb | B | Co | Ta | Fe |
|---|---|---|---|---|---|---|---|---|---|---|---|---|---|
| 0.03 | 0.03 | 0.003 | 0.004 | 19.06 | 0.44 | 1.05 | 3.06 | 51.97 | 5.25 | 0.005 | 0.01 | 0.01 | Bal. |
Each ingot was sectioned radially through the centre line at the top end, producing a slab roughly 508 × 500 × 25 mm. The faces were ground flat and polished, then macro-etched in a mixture of CuSO4 (150 g), H2SO4 (35 mL) and HCl (500 mL). Micro specimens were cut from the centre, the R/2 position and the edge of the same slab, etched in CuCl2 (5 g) plus acetic acid (100 mL) and HCl (100 mL), and examined on an OLYMPUS GX71 optical microscope and a Shimadzu EPMA-1720 electron probe.
Macrostructure: Columnar Growth, and a Centre That Turns Equiaxed
Figure 1 shows the macro-etched sections. Away from the shrinkage cavity at the top face, all three ingots are built the same way at the outside: a thin chill zone at the mould wall, then columnar dendrites leaning inward from the edge towards the centre. What changes with melting rate is the middle. At the low rate the columnar structure runs all the way to the axis. At the high rate an equiaxed zone has appeared from R/2 inward.
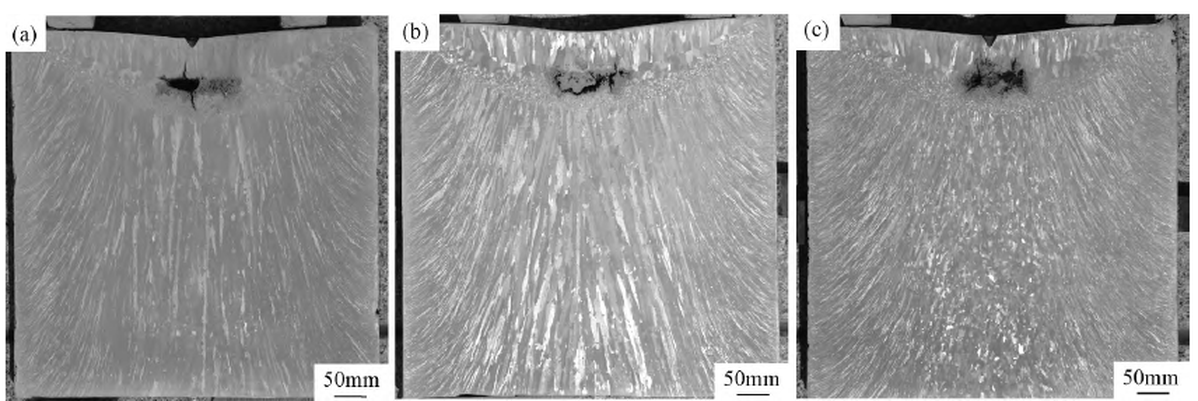
The edge structure is the expected outcome of competitive growth. The mould wall extracts heat so fast that a fine surface skin forms first, and the grains that survive are the ones whose primary arms point most closely along the heat-flow direction — they outrun their misoriented neighbours, squeeze them out, and the further the front advances from the wall the more tightly the surviving columnar grains are aligned and the coarser they become. That is why dendrite spacing rises monotonically from edge to centre in every ingot, independent of melting rate.
The equiaxed centre at the high rate is a constitutional supercooling effect. Raising the melting rate puts more superheat into the pool but does not improve cooling at the mould, so the temperature gradient in the middle of the ingot flattens and the solid–liquid mushy zone widens. Once the liquid ahead of the front is undercooled below its own liquidus, new nuclei can survive there instead of remelting, and solidification switches from columnar growth off the wall to equiaxed growth in the bulk. The transition is not cosmetic: an equiaxed centre is more isotropic and less prone to centre-line segregation, but it also carries a different ultrasonic noise signature, which is exactly the sort of structure change that shows up later as an indication in a billet. The link between structure and inspectability is covered in our note on a Φ180 mm bar that failed ultrasonic testing on a coarse-grain ring at R/2.
The shrinkage cavity at the top deserves a separate sentence, because it is a melting-rate-independent feature that still gets blamed on the furnace. When the arc is switched off at the end of the hot top, heat input stops, the helium boost is cut, and the top surface becomes a new radiating face. The surface freezes as columnar grains while liquid is still trapped underneath; that liquid cannot be fed, so it contracts into a pipe, and the last pockets, isolated by already-solid grains and too viscous to feed anything, freeze as scattered microporosity around it. Solidification shrinkage, not gas, is the cause — which is why the fix is a hot top with enough liquid and enough time, not a change of melting rate.
Melt Pool: 100, 125 and 186 mm Deep
The pool profile was traced by hand on each macro section (Figure 2). At the low rate the pool is 100 mm deep with a shallow, flat-bottomed pan shape. The medium rate gives 125 mm and a circular arc. The high rate gives 186 mm and a pronounced U — nearly twice the depth of the low-rate pool, from a change of 0.7 kg/min.
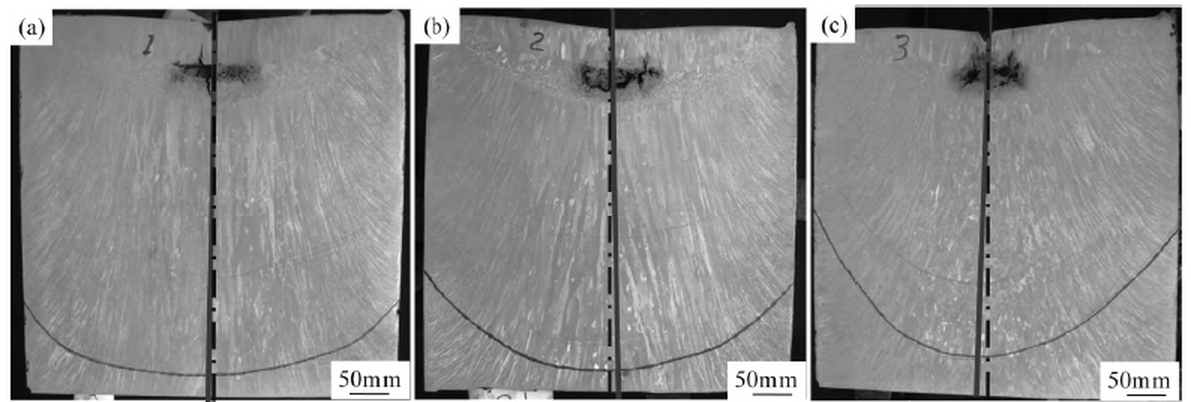
The three heats were logged at 112.3, 123.4 and 149.9 kW of input power (current × voltage). Regressing pool depth against power across the three points gives a straight line with a correlation coefficient of 0.99:
A slope of 2.29 mm/kW is the useful number here. The mould removes roughly the same heat per unit time whatever the melting rate, so a higher rate necessarily means more heat delivered — and after the arc itself is fed, the surplus goes into keeping a larger volume of metal molten and superheated. The solidus and liquidus isotherms are pushed down, the mushy zone thickens, and the pool deepens. Deeper pool also means longer solidification time and more room for the pool to drift, which is why the symmetry degrades: the angle between the ingot centre line and the columnar growth direction opens up as the rate rises, and the two sides of the high-rate ingot are visibly not mirror images.
Pool depth is the single measurement worth putting on a VAR process sheet, because it collapses current, voltage, gas cooling and ingot size into one number that can be checked on a sectioned ingot. The equation above is furnace-specific and will not transfer to another VAR, but the method will: three rates, three sections, one regression.
Secondary Dendrite Arm Spacing: 100 to 130 µm
Figure 3 shows the dendrite structure at the three positions in each ingot, and Table 2 gives the secondary dendrite arm spacing. No value is reported for the edge: helium cooling at the mould makes the primary spacing so tight and the secondary arms so underdeveloped that they cannot be measured meaningfully. That in itself is a result — the edge of a VAR ingot is not where the structure problem lives.
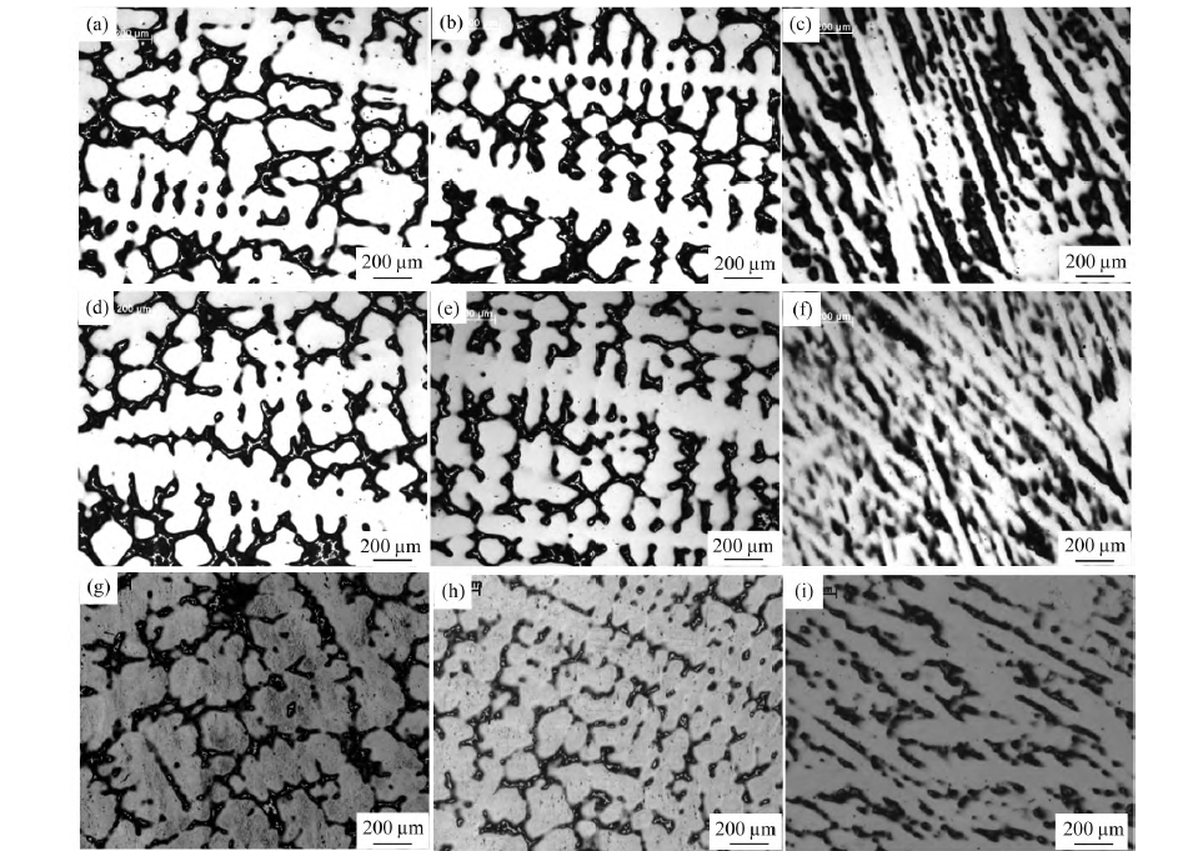
Table 2: Secondary dendrite arm spacing of the Φ508 mm IN718 VAR ingots (µm).
| Melting rate | Centre | R/2 | Edge |
|---|---|---|---|
| Low (base − 0.7 kg/min) | 120 | 100 | not measurable |
| Medium (base) | 124 | 114 | not measurable |
| High (base + 0.7 kg/min) | 130 | 120 | not measurable |
Two patterns hold. Within a single ingot the centre is always coarser than R/2 — 120 against 100 µm at the low rate — because the centre cools last. Across the three ingots the spacing rises with melting rate at both positions — by 10 µm at the centre and 20 µm at R/2 across the two 0.7 kg/min steps that separate the low and the high heat.
Melting rate acts on spacing through two opposed channels, and the measurements say the second one wins. More power means more heat flux into the pool and therefore a steeper gradient, which should refine the structure. But more heat also means a deeper pool, slower extraction and a longer local solidification time, which coarsens it. Coarsening is the classic λ2 ∝ tfα relationship, with α below unity, and it is driven by interfacial energy: a dendrite array lowers its total solid–liquid energy by reducing surface area, so high-curvature regions melt back while low-curvature regions grow. The Gibbs–Thomson effect supplies the composition difference that drives solute diffusion between them, and the process runs as long as there is liquid and time.
At the high-rate centre there is enough of both for the arms to merge outright: Figure 3(g) shows secondary arms fused into each other, not merely thickened. Once arms coalesce, the spacing measurement stops describing a diffusion distance and starts describing a pooled liquid volume, and the Nb that was partitioned between the arms is redistributed into fewer, larger interdendritic spaces.
Laves Phase: A Centre-to-Edge Gradient, Not a Rate Effect
The same nine positions were mapped for niobium on the electron probe over 1 × 2 mm fields, and the area fraction of Laves phase was measured from the maps by pixel counting. In Figure 4 the matrix is blue and the Nb-rich Laves phase is yellow-green against the Nb count scale.
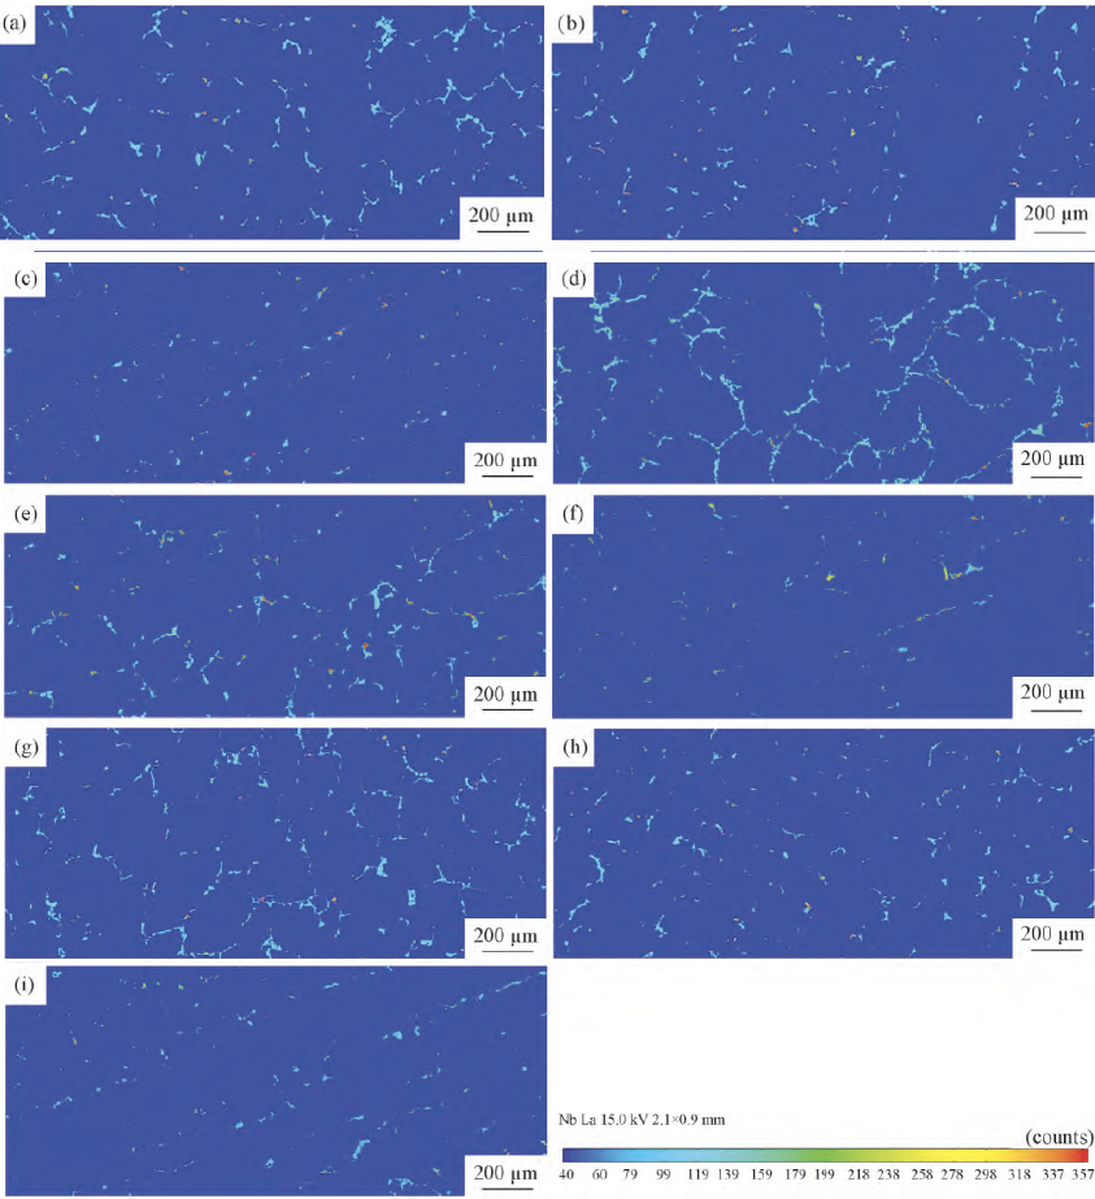
The result that matters is not the melting-rate comparison, it is the radial gradient. At any of the three rates, the centre carries visibly more Laves phase than R/2, and R/2 carries far more than the edge, where the phase appears only as scattered fragments. Increasing the melting rate adds a little at the centre and changes almost nothing at the edge.
The mechanism is straightforward once the cooling path is in view. Laves phase forms from liquid enriched in Nb and Ti that has been rejected by the advancing dendrites; where solidification is fast — the helium-cooled edge — there is no time for that enrichment to develop and no time for the phase to precipitate, so the edge is nearly clean. Moving inward, the local cooling rate falls, niobium accumulates in the interdendritic liquid, and the fraction of Laves phase rises. A higher melting rate slows that cooling a little further, which is why the centre gains and the edge does not.
What It Costs Downstream: Homogenisation Time
None of this stays in the melt shop. The Laves phase and the niobium segregation have to be removed before the ingot can be forged, and that is done by a two-stage homogenisation: 20–30 h at about 1160 °C to dissolve the low-melting interdendritic phases back into the matrix, then 48–72 h at 1190–1200 °C to let niobium diffuse far enough to even out. Push the second stage hotter and you shorten the cycle, at the risk of incipient melting at the grain boundaries; push it longer and you pay for furnace time and grain growth.
Homogenisation is a diffusion problem, and diffusion distance scales with dendrite spacing. That is the commercial argument for a moderate melting rate: a 120 µm spacing at the centre is a shorter path than 130 µm, and a thinner Laves network dissolves faster. Every 0.7 kg/min of extra melting rate buys furnace throughput at the VAR and pays for it at the homogenisation furnace and at the press, where a coarser, more segregated centre is harder to forge without residual black-spot risk.
The three heats line up side by side in Table 3. The trend runs one way in every measured column, which is the practical takeaway: melting rate is not a switch, it is a dial with a measurable cost curve attached.
Table 3: The three heats compared — input power, pool depth, dendrite spacing and centre structure.
| Parameter | Low | Medium | High |
|---|---|---|---|
| Input power (kW) | 112.3 | 123.4 | 149.9 |
| Pool depth (mm) | 100 | 125 | 186 |
| Pool shape | Shallow, flat-bottomed | Circular arc | Deep U |
| Secondary dendrite spacing, centre (µm) | 120 | 124 | 130 |
| Secondary dendrite spacing, R/2 (µm) | 100 | 114 | 120 |
| Centre structure | Columnar to axis | Columnar | Equiaxed from R/2 inward |
Conclusions
1. Symmetry and structure. All three ingots grow the same fine columnar dendrites at the edge. As melting rate rises the pool deepens from 100 to 186 mm, the pool loses left–right symmetry, the angle between the columnar growth direction and the ingot axis widens, and the centre converts from columnar to equiaxed.
2. Dendrite spacing. The centre is always coarser than R/2 in the same ingot, and spacing rises with melting rate at both positions, from 120 to 130 µm at the centre and 100 to 120 µm at R/2. The high-rate centre shows secondary arms coarsened to the point of coalescence; the edge is too fine to measure at any rate.
3. Laves phase. Melting rate has only a small effect on the amount of Laves phase precipitated, but position has a large one: centre more than R/2, and far more than the edge, because local cooling time sets how much Nb can accumulate between the dendrites.
Where Fushun Metal Fits
FUSHUN METAL supplies Inconel 718 and its Chinese equivalent GH4169 in bar, billet and forging stock, melted by VIM plus VAR and, where the application calls for it, by the triple route of VIM, ESR and VAR. The point of publishing this kind of data is that the process variables are not a black box: melting rate, pool depth and dendrite spacing are recorded per heat, and the homogenisation cycle that follows is set from the structure that came out of the mould rather than from a default recipe.
The downstream side of the same chain is covered elsewhere on this site — how forging temperature and deformation control the γ′/δ structure of a disc in Inconel 718 turbine disc forging parameters, and what it takes to press a Φ2440 mm GH4169 turbine disc without a structural surprise in the ultrasonic test. The upstream argument — why cleanliness and homogeneity are the two variables that decide what a premium alloy is worth — is set out in ultra-clean and highly homogeneous alloy production.
If you are buying VAR IN718, ask for three things beyond the certificate: the melt route for the heat, the macrostructure photograph of the top section, and the secondary dendrite spacing at the centre and at R/2. Those three numbers tell you more about how the billet will forge and how it will inspect than the chemistry does, provided the chemistry is already inside the specification. Send us the grade, the section size and the end use, and we will come back with the melt route, the structure data and the test documentation that goes with the heat.